Failure in a final drive motor is always bad -- but a good understanding of basic metal failure can help understand what causes it and lead to a better understanding of metal behavior in general.

In this Shop Talk blog post, you'll learn about basic metal failure and the material properties that explain it. This includes an introduction to tensile testing, a discussion of key metal parameters, and an example of how these parameters can vary.
Here are two other blogs in this series:
Dr Mac's Notebook: Basics of Mechanical Stress
Dr Mac’s Notebook: Displacement Under a Load
Quick Introduction to Tensile Testing
The American Society for Testing and Materials (abbreviated ASTM) has standards for performing tensile tests on metal specimens. These tests establish key attributes such as yield strength, ultimate strength, and percent elongation, which we’ll discuss in detail later in this blog post. I’ve run many of these tests as a college student and former professor. And at the University of Texas at Tyler, we used an Instron tensile testing machine similar to the one shown in the video below.
When you run a tensile test you are applying a tensile load along the length of the specimen and measure how it changes in length (which is recorded as strain, change / original length) based on the force applied to it (recorded as stress, force / cross-sectional area). This goes in until the material breaks.
The data gathered during the tensile test is summarized as a stress-strain curve.
Stress-Strain Curves
Below is a general stress-strain curve with the key points and regions labeled.
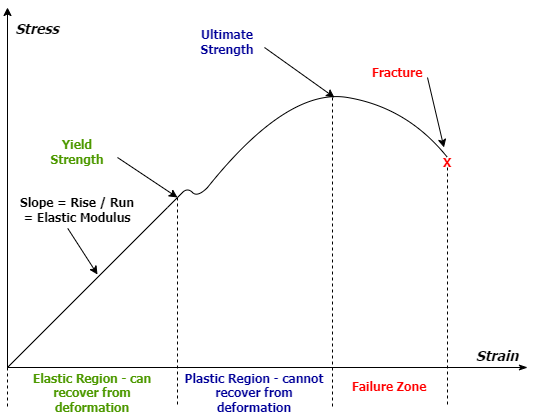
The vertical axis represents stress (force/area), and the horizontal axis is strain (change in length/original length). The stress depends on the load applied and the area it is applied over. Strain is calculated based on the displacement, or how much the specimen has stretched, and the material type. Because of this, the stress-strain curves will have different values depending on the type of metal being tested. However, the general shape for metals will be similar and the values labeled in the graph will be identifiable.
When a load is applied to a metal specimen, there are four regions we can identify in the graph. The first is the elastic region, where the specimen can recover its original shape by removing the load. The point at which this region ends is called the yield point. The material can't recover its original shape when stress is applied beyond the yield point. The next region in the graph starts at the yield point, called the plastic region. Once the specimen has reached the plastic region, any change in length or overall shape is permanent.
The next region is the failure zone which starts when the material can longer carry a load. That point is the material’s ultimate strength. Once the specimen has reached the failure zone, its performance under load is no longer dependable.
For example, if you're watching a tensile test, you may see the specimen start stretching very rapidly and then break, or fracture -- and you’ll probably hear it, too. When I used to run tensile tests, I’d always warn onlookers when that snap was about to occur.
Another data item obtained during a tensile test is the % elongation at failure. This is a measure of how much the original length of the specimen changed during the test. Very brittle metals usually have very small values, while ductile metals will have larger values.
Metal Failure: Alloys and Treatments
In an earlier post, we discussed how a material's stiffness (or elastic modulus) remained consistent within different categories, such as aluminum, steel, cast iron, or copper. However, this isn’t the case with the yield point and ultimate tensile strength. These values can vary in material depending on the type of alloy and heat treatment used.
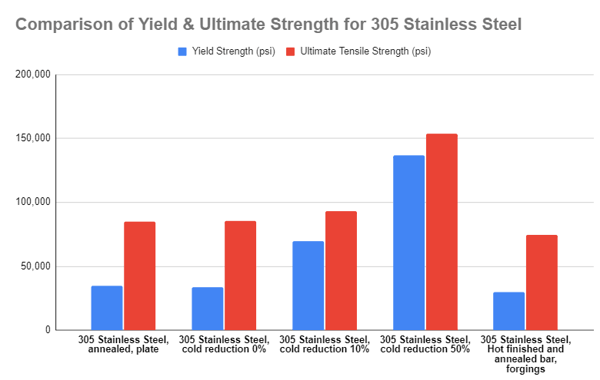
We will look at 305 stainless steel with different heat treatments and levels of cold forming as our first example. Here you can see how the yield strength, ultimate tensile strength, and elongation vary significantly. And keep in mind that all of these 305 stainless steel types have the same modulus of elasticity: 28,000 ksi.
| Material | Yield Strength (psi) | Ultimate Tensile Strength (psi) | Elongation (%) |
| 305 Stainless Steel, annealed, plate | 34,800 | 84,800 | 55 |
| 305 Stainless Steel, cold reduction 0% | 33,800 | 85,300 | 62.3 |
| 305 Stainless Steel, cold reduction 10% | 69,600 | 93,300 | 45.5 |
| 305 Stainless Steel, cold reduction 50% | 137,000 | 154,000 | 7.5 |
| 305 Stainless Steel, Hot finished and annealed bar, forgings | 29,700 | 74,700 | 30 |
Let's look at the summary for T 600 series stainless steel. The MatWeb Material Properties Database has 37 listings for T 600, and here is some of the information from the summary page. Note how the modulus of elasticity doesn't change much but the other properties do.
| Min | Max | |
| Ultimate tensile strength (psi) | 79,800 | 249,000 |
| Yield strength (psi) | 7,570 | 230,000 |
| Elongation at break (%) | 3 | 63 |
| Modulus of Elasticity (ksi) | 28,600 | 29,000 |
Conclusion
Manufacturers and engineers design things like final drive motors and planetary gear hubs with certain materials for a reason. While most of the failures experienced within a final drive motor aren't simple tensile failures (except for most bolt failures), this does give us some insight into material strength and how it can vary even across the same type of metal.
If your final drive motor has failed and you send it in for repairs or reman, you can count on the experts at Texas Final Drive to help you track down the cause. And when you need a replacement, we have a massive inventory of reman and new aftermarket final drive motors.

Sources for Material Properties:
305